EURUSD Outlook Week of January 14 2013
The picture for this week is frankly unclear, so we’ll keep it short
Fundamental
Risk assets remain in their fiscal cliff relief rally, and that overall risk-on sentiment is lifting the EURUSD. The ECB’s relatively hawkish press conference helped maintain the EUR’s interest rate advantage over the USD. Whether or not that sentiment continues this week depends on the following likely market drivers.
Earnings Season Results
This week Q4 2012 earnings season kicks into high gear with far more marquee names reporting. Expectations are not high, making any positive surprise that much more bullish. Focus will be on whether firms are able to expand top line sales revenue after having already cut costs to adjust for an overall stagnant global economy.
Other Calendar Events
Top events include:
- Monday: Fed Chairman Bernanke’s speech may nudge sentiment about how serious the Fed really is about tightening. We’re skeptical and expect no changes in the coming months.
- Tuesday: US retail sales
- Wednesday: US CPI
- Thursday: Australia jobs reports, US building permits, weekly new jobless claims, housing starts, and Philly Fed Mfg Index
- Friday: A batch of China data which could move markets if it all points in the same direction, UK retail sales, and US UoM consumer sentiment.
Technical
As noted below, risk assets in general are near decade highs and multi-year resistance, so in the absence of some new fundamental bullish catalyst like a very positive earnings season, there may be strong temptations to take profits and at least pause if not pull back.
Long Term Perspective
As discussed in depth in our recent article, 2012’S Biggest Lie, 2013’s Biggest Risk, markets appear to be irrationally underestimating the risks of a new bout of EU crisis anxiety. So this week we step back for a longer term view of the pair.
Fundamental
The current EURUSD rally is not stemming from a change in the EU. Instead, it’s mostly just part of an an overall rally in risk assets that began following the US elections, paused in the final weeks of 2012 on US fiscal cliff uncertainty, and has rallied since the start of 2013 on relief over the temporary removal of that uncertainty.
Otherwise, as we discussed in out summary of 2013 forecasts here, the consensus view points to only modest moves up or down in risk assets over the coming year, which implies the same for the EURUSD. We suspect this view may be too optimistic given the underestimation of EU risk.
Technical
We refer to the weekly EURUSD chart below.
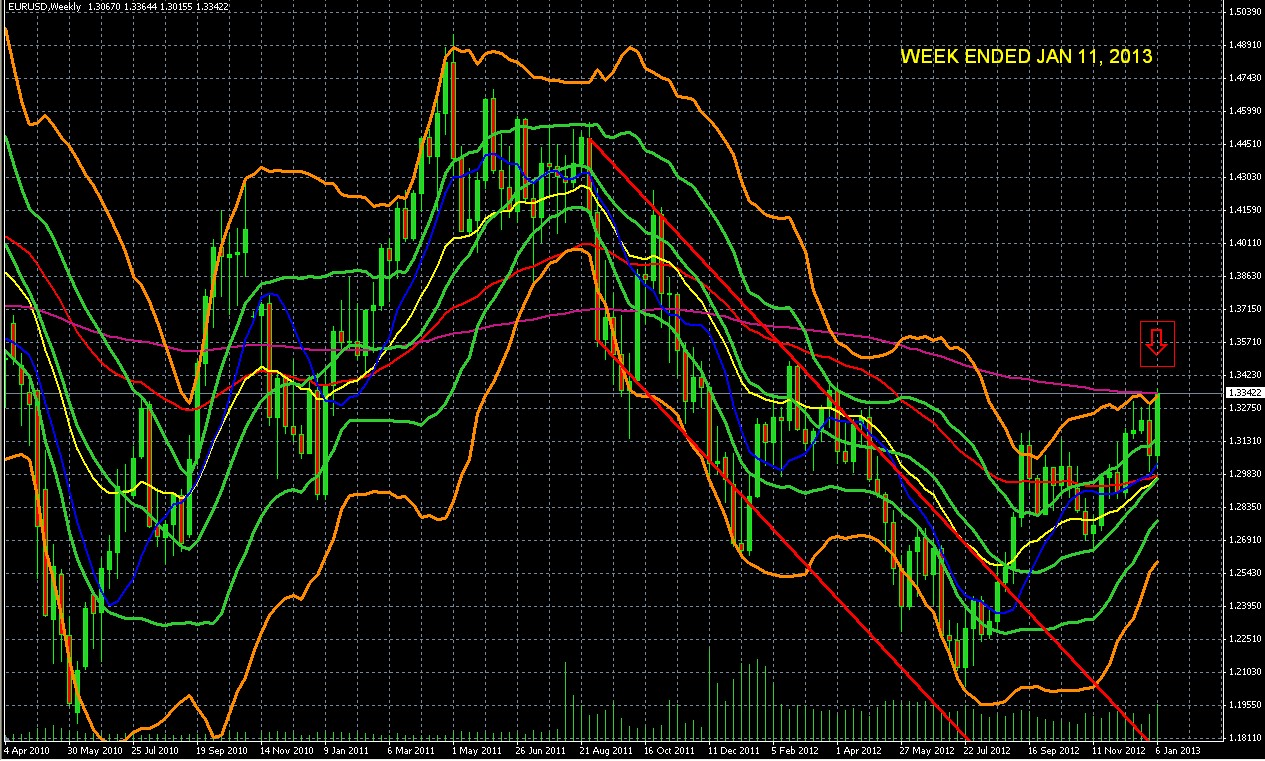
EURUSD WEEKLY CHART APRIL 2010 – JANUARY 11 2013
Source: MetaQuotes Software Corp, thesensibleguidetoforex.com
01 jan 130341
Long Term Market Cycles: Bearish
Long term risk assets are at decade highs of a cyclical bull market within a longer term secular bear market. That suggests limited upside for any risk asset, including the EURUSD.
EURUSD Chart: Mixed Signals
The weekly EURUSD picture shows conflicting signals
Bullish: Multi Month Bullish Trend and Momentum
- In firm uptrend since July 2012
- The 10 (blue) 20 (yellow) 50 (red) exponential moving averages EMAs all moving higher, with the 10 and 20 week EMAs crossing above the 50 week EMA, which suggests increasing upward momentum
- The past week’s price action put the pair in the upper part of its double Bollinger bands, the ‘buy zone’ (bounded by the upper orange and green Bollinger bands) that suggests continued upward momentum. For a review of how to interpret double Bollinger bands see here.
Bearish: Multi- Year Downtrend Intact And Hitting Multi-Year Resistance
- The pair remains in an overall downtrend since May 2011
- The pair is hitting strong resistance around the 1.3500 area, which has both this big round number and the 200 week EMA (violet). The long (aka engulfing) bullish candle could be interpreted as signaling either strong upward momentum or a “blowoff” top that indicates coming exhaustion of the move just before this resistance area.
DISCLOSURE /DISCLAIMER: THE ABOVE IS FOR INFORMATIONAL PURPOSES ONLY, RESPONSIBILITY FOR ALL TRADING OR INVESTING DECISIONS LIES SOLELY WITH THE READER

