Markets Rallying Higher Or Triple Top? Evidence Pro And Con
The current array of bullish and bearish forces
Each week reveals new bulls, and more deeply entrenched technical momentum. Of course, everyone felt great about stocks and other risk assets back in 2000 and 2007 too.
Here’s a survey of the available bullish and bearish evidence. Regardless of whether your focus is equities, forex, commodities or bonds, these are the forces that will move all markets. Whether you view the overall picture as bullish or bearish will determine your big picture strategy. Even long term passive investors still need to adjust their stop losses from time to time, especially when markets are at all time highs and decade old resistance levels that have smacked markets back twice before.
1-9. Bullish Fundamentals
Here’s how the bullish forces line up
US Data
US data continues to confirm the slow but steady recovery story. The bigger not so subtle subtext is that Washington’s looser monetary policy is not only politically more expedient (compare how US incumbents fared in recent national elections versus their European counterparts (France, Italy, Germany, Ireland, etc), so far it seems to be working better. Inflation remains a concern, but thus far remains acceptably low.
Highlights from the past week include:
1. Initial jobless Claims Uptrend Suggests Stocks Rally Can Continue: As the chart below shows, that suggests continued rise in the S&P 500 as long as the very strong positive correlation between improving initial jobless claims and the S&P 500 continues. See here for details

(via businessinsider.com here)
01 mar 16 2148
2. Rail Traffic Volume Continues Improving: That doesn’t happen during recessions. See here for more.
3. Retail Spending Remains Healthy: This despite a substantial increase in payroll taxes. This is a really big deal for the US because about 70% of US GDP depends on consumer spending. Retail sales are an excellent barometer of that. See here for more. This is somewhat surprising given that incomes are stagnant. Economist Michelle Meyer suggests that Americans are simply accepting a lower level of savings.
4. Morgan Stanley Report Suggests Deleveraging Ending: This supports the above data that the US recovery is slow but real. The implication is that decreasing deleveraging should support improved US consumer spending (and thus US GDP growth- a big deal given that 2012’s GDP growth of 1.5% was below the 2% minimum believed necessary to avoid recession). Another key point of this report is that effect of an economic crisis on growth recedes over time. That means if the US can keep muddling through with even just weak growth, that modest forward progress by itself makes a relapse less likely. See here for specifics. Our take: this reminds us of our conclusion from our summary of 2013 forecasts. All depends on whether ongoing stimulus policies can keep the US, EU, Japan, and other major economies out of crises that drag the world back down.
Our biggest concern remains the EU. More on that below
5. South Korean Exports Appear To Have Bottomed And Are Rising: UBS, Goldman Sachs, and other institutions refer to this data as a “canary in the coalmine” for the global (especially Asian) economy, because it’s the first Asian export data to come out each month, and Korea’s exports are very exposed to Japan and China, the second and third largest economies. See here for more on that.

(Morgan Stanley)
03 mar 16 2220
6. Profit Margins and Stock Valuations Historically High, However…: Valuations are in the eye of the beholder (see here and here for those who don’t see stocks as overvalued), and while profit margins are cyclical, they are trending higher, it’s unclear just how much mean reversion we’ll see, or when we’ll see it. See here for more.
7. The Growing US Oil Production Story Gaining Traction: The story itself has been around for years, but as markets rally and pundits look for reasons after the fact to justify it, this story is gaining believers.
8. Demographics – Enter The Echo Boomers: The children of the baby boomers, the echo boomers, are entering their prime productive and investing years. This story too has been around for a while, as their numbers started trending higher again around 2011. Unlike some other bullish arguments however, this one is hard to deny and will support stock prices for decades. For those seeking justification for higher asset prices, this is a good one to remember. See here for more.
9. Easy Monetary Policy Expected To Remain Easy For Years: While US policy may begin to tighten in the coming 12-24 months, that process is expected to be slow, and overall policy should remain accommodative for years yet. See here and here for examples of this thinking. Per the below table from Gluskin Sheff, as long as economies keep expanding, the bellwether S&P 500 continues higher even.
10-11. Bullish Technical Factors
Deeply Entrenched Uptrend: As the weekly chart of the bellwether S&P 500 shows, the uptrend that began in September 2011 is very entrenched and can absorb a lot setbacks before we even begin to question it. That momentum alone can, and does, suck in new money to keep it going.
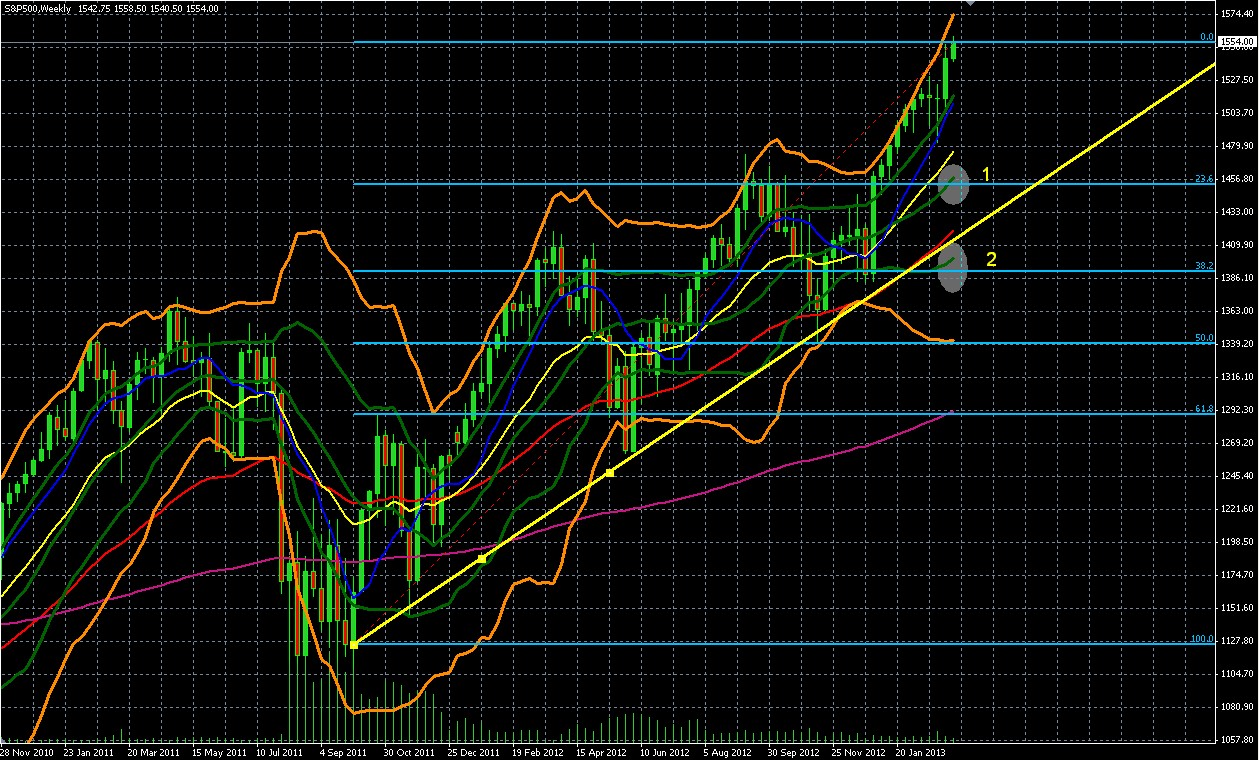
S&P 500 WEEKLY CHART DECEMBER 2010 – PRESENT
Source: Source: MetaQuotes Software Corp, thesensibleguidetoforex.com, The Sensible Guide To Forex
06 mar 16 2351
Highlights Include:
10. Continued Healthy Upward Momentum
–The index completes its 11th week firmly in the Double Bollinger Band Buy Zone (bounded by the upper orange and green Bollinger bands). See 4 RULES FOR USING THE MOST USEFUL TECHNICAL INDICATOR, DOUBLE BOLLINGER BANDS for a brief explanation on how to understand Double Bollinger Bands, which are arguably one of the most useful indicators extant. Bottom line-it shows the trend’s momentum remains healthy enough to consider new long positions.
— Confirming that upward momentum, all the exponential moving averages (EMAs), the 10 week (blue), 20 week (yellow), 50 week (red, and a rough equivalent of the more widely watched 200 day EMA) and 200 week (violet) are all trending higher, in the most bullish form, the shorter durations on top and rising fastest.
11. Two Layers of Strong Support: Before this uptrend is broken price must decisively break below:
The 1456 area (ellipsis 1), which is comprised of double layered support from the 20 week EMA (yellow line), the 23.6% fib retracement line (second horizontal blue line from the top)
The 1386 area (ellipsis 2), which contains triple layered support from the 50 week EMA (red), the trend line (yellow) from the start of this uptrend in Q4 of 2011 (start of QE 2), and the 38.8% fib retracement line (third horizontal blue line from the top)
1-5.Bearish Fundamentals
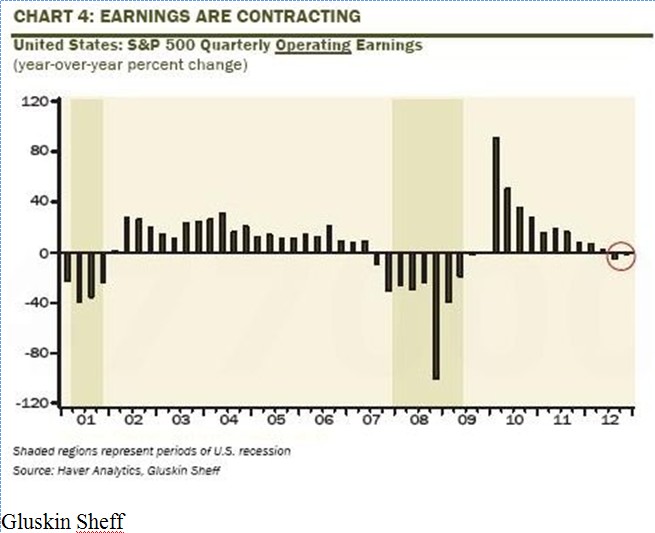
1. Earnings Contracting
Analysts from both ECRI and Gluskin Sheff (here and here) very reasonably point out, this rally is not supported by improving earnings, which in fact are falling, and so undermine the credibility of the current rally as one driven by asset price inflation from stimulus programs that must eventually be withdrawn.
For example, Gluskin Sheff’s David Rosenberg writes:
My database is from Haver Analytics, who get their numbers from Standard & Poor’s, and the latest update was on March 6th. And at last count, S&P 500 Q4 operating EPS is running at -1.7% on a YoY basis, and at a $23.32 estimate right now for last quarter, it is actually running only moderately above the level prevailing in Q4 2006 ($21.99). So on this basis, earnings have only eked out a mere 0.8% annualized gain over the past seven years.
2. Improving Retail Sales? Restaurant Sector Curbs Our Enthusiasm

(via businessinsider.com)
10 mar 1700 19
09 mar 170012
3. 2010, 2011, and 2012 Also Began With Gains, Followed By Corrections
Comstock Partners adds some perspective to this year’s rally:
The market’s positive beginning to the year is far from unique, and is not much different than the start of each of the last three years. 2010 began with a gain in the S&P 500 of 9.2% only to be followed by a 15.6% correction. Similarly, the next year started with an increase of 8.4% and then corrected by 19.4%. Early last year the market gained 13.1% before dropping 10.5%. So far this year the market has jumped 9.6%, similar to the gains of the prior three years. With investor sentiment extremely high and serious domestic and foreign problems still unresolved, we think that not only are the chances for a major correction quite high, but that the entire market rise since March 2009 may be coming to an end.
Indeed the headwinds we’ve mentioned in weeks past remain, and some have worsened, for example, the EU.
4. EU: Deteriorating Data and Political Uncertainty
Although EU data outside of Germany has been getting worse, EU leaders have managed to somehow keep markets confident that all was under control for the near future. However this past week Société Générale strategists warned of another “Eurozone shockwave” coming this spring due to elections in Italy and Germany.
Italy remains without a new ruling coalition, and the parties opposing Brussels approved reforms are gaining strength, a worst case scenario for Italy. Last week European markets took a hit after an unsuccessful Italian bond sale hinted that the political uncertainty is starting to hit the fragile improvement in Italian borrowing costs. If those make a sustained spike, Italian solvency concerns would likely kick off new EU anxiety. OMT might not even be available to Italy unless it has a stable coalition.
That in turn could rouse fears yet again about Spain, which has benefitted from falling borrowing costs despite zero economic improvement.
Meanwhile German elections loom this fall and will limit PM Merkel’s ability to offer up yet more German taxpayer money for Italy.
5. China Growth Overstated?
A number of prominent analysts have raised doubts about the reliability of China’s export data, because it appears so much better than that of South Korea and Taiwan. See here for details. Marc Faber has again sounded warnings of a China credit bubble. Given China’s attempts to cool property speculation, there appears to be at least some reasons to share Faber’s concern.
6. Bearish Technical Factor
The only obviously bearish technical aspect of the below chart (a monthly version of the above weekly S&P 500 chart) is that resistance in the 1550 area still has not been decisively broken.

S&P 500 MONTHLY CHART MAY 2003 – PRESENT
Source: Source: MetaQuotes Software Corp, thesensibleguidetoforex.com, The Sensible Guide To Forex
11 mar 17 0348
The bull markets of 2000 and 2007 couldn’t break past this level, and back then the supporting fundamentals at least appeared much better. The consensus outlook was for continued earnings growth, a healthy and growing housing and banking sector (an apparently minor issue with subprime loans back in 2007, but that was containable, right?)
Conclusions: So What Do You Do?
Here’s our take on life at the edge of either:
- The next leg higher, which is what most in the financial press seem to believe is coming
- The imminent pullback that revives bearish case for a grand triple top
No Drastic Changes Until A Decisive Move In The S&P 500
That’s my preferred risk barometer, feel free to use another that works better for you. In other words, I’m not selling or buying much at this time. Trimming some positions that have shown weakness, entering some limit orders to catch a significant pullback if it comes.
We don’t fight the trend, especially when its backed by the central banks of the largest economies.
Therefore we have no new shorts at this time, though we have some plans if a real pullback developes.
For both equities and currencies, the current trends remain valid until proven otherwise, as always.
As always, we repeat our warning about having all your assets denominated in or linked to just one or two currencies. There are just too many major central banks taking too many risks with your local currency, and all you have tied to it.
Even if you spend in just one currency, or hold stocks of big multinationals, that doesn’t mean you’re insulated from the risks of having everything you own denominated in or linked to just one currency.
- Stocks of multinationals in theory could do that, but in fact they tend to move with their local stock indexes.
- Most of us spend in one currency, but most of the goods and services we buy either have a high proportion of inputs that are either imported or linked to global prices.
See here or here for information about one good guide from your humble author about simpler, safer ways to get that currency diversification than you’ll find in most guides on currency trading or foreign asset investing.
DISCLOSURE /DISCLAIMER: THE ABOVE IS FOR INFORMATIONAL PURPOSES ONLY, RESPONSIBILITY FOR ALL TRADING OR INVESTING DECISIONS LIES SOLELY WITH THE READER.

