EURUSD June 16 Weekly Technical, Fundamental Forecast: Breakdown Or Bounce? Here’s What Decides
FX Traders’ weekly EURUSD fundamental & technical picture, this week’s market drivers that could change it- the bullish, the bearish and likely EURUSD direction.
The following is a partial summary of the conclusions from the fxempire.com weekly analysts’ meeting in which we cover outlooks for the major pairs for the coming week and beyond.
Summary
- Technical Outlook: Edging towards confirmed top. As for a reversal, we need a lower move before we can call the start of the next leg down.
- Fundamental Outlook: Neutral near term, bearish longer term. Light calendar suggests fundamentals not likely to move the pair.
- Conclusions: Confirmed break or holding of support could determine the pair’s direction given the likely lack of fundamental surprises. FOMC optimism might provide the push needed.
- Trader Positioning: Retail traders making classic mistake of playing a bounce that hasn’t started.
- Conclusions: What’s needed to change expectations, and bring a EURUSD breakout
Technical Outlook
For the first time in 6 weeks, the EURUSD had the bearish uncertainty about ECB stimulus lifted, so it could resume its usual tracking of overall risk appetite as reflected by the major US and European stock indexes.
Overall Risk Appetite Per Weekly Charts Of Leading Global Stock Indexes: Taking A Break
Overall risk appetite as reflected in US and European indexes took a break last week, but its outlook for the coming weeks remains firmly bullish as nothing suggests this was more than a normal technical pause, understandable after a long steady rise, significant overhead resistance looming just above, and no potent bullish news to justify a successful test of that resistance just yet.
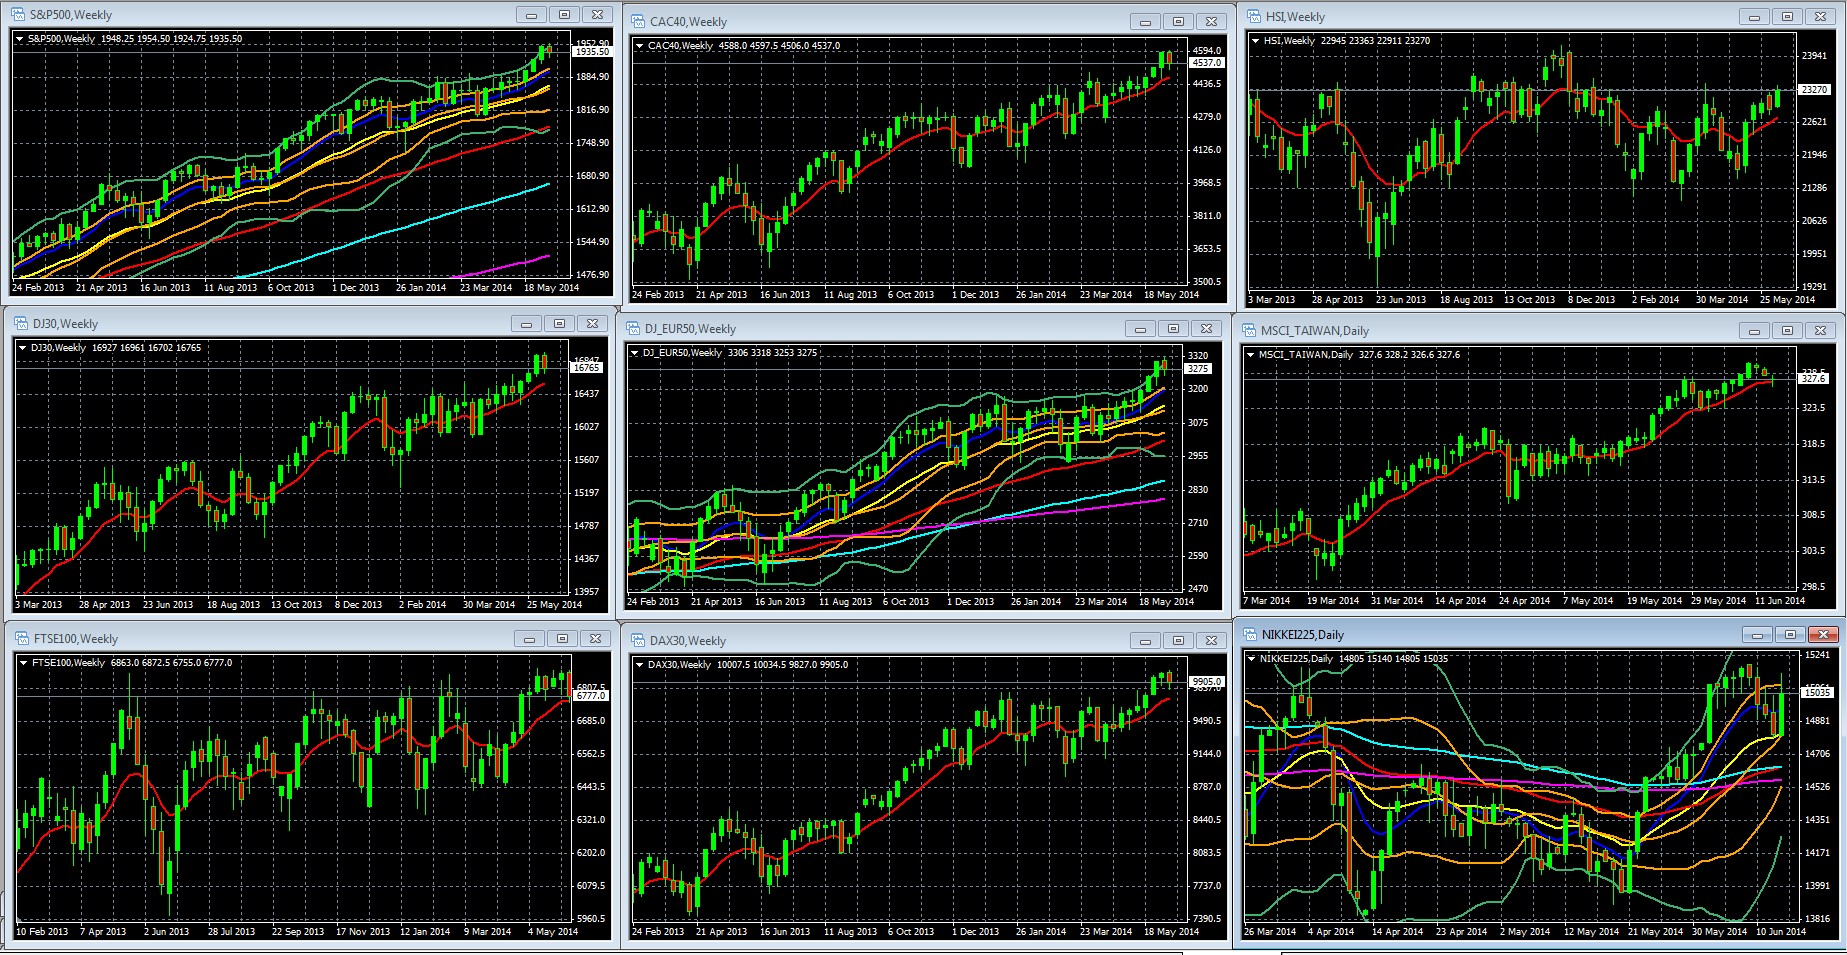
Weekly Charts Of Large Cap Global Indexes Feb 24 2013 To Present With 10 Week/200 Day EMA In Red: LEFT COLUMN TOP TO BOTTOM: S&P 500, DJ 30, FTSE 100, MIDDLE: CAC 40, DJ EUR 50, DAX 30, RIGHT: HANG SENG, MSCI TAIWAN, NIKKEI 225
Key For S&P 500, DJ EUR 50, Nikkei 225 Weekly Chart: 10 Week EMA Dark Blue, 20 WEEK EMA Yellow, 50 WEEK EMA Red, 100 WEEK EMA Light Blue, 200 WEEK EMA Violet, DOUBLE BOLLINGER BANDS: Normal 2 Standard Deviations Green, 1 Standard Deviation Orange.
Source: MetaQuotes Software Corp, www.fxempire.com, www.thesensibleguidetoforex.com
02 Jun. 14 21.57
Key Points
Our sample of weekly charts for leading global stock indexes shows all of our sample leading US and European indexes down together for the first time in a while, driven by a combination of fundamental factors discussed below, as well as nearby overhanging technical resistance of big round numbers (like 2000 on the S&P 500 and 17,000 on the DJIA).
In sum, while they all retain strong medium term upward momentum as per their weekly charts, we’ve a perfectly normal minor pullback given the intimidating resistance and lack of news to draw in buyers quite yet. Investors will likely be watching for a near term bottom to form before considering new longs that could fuel another assault on yet another all-time high above these level on the US indexes (which of course influence EU indexes).
EURUSD Specific Technical Outlook: Edging Towards Confirmed Topping
Long Term Outlook Per Monthly Charts: Bearish- Time For New Long Term Shorts?
The long term downtrend line from July 2008 is looking safer as the threat to the 2008 downtrend line recedes. For now traders are respecting the long term downtrend. As discussed in fundamentals section below, ECB easing along with Fed, BoE moves to steady or tighter policy reinforce long term bearish bias for EURUSD.

EURUSD Monthly Chart April 2005 to Present
KEY: 10 Month EMA Dark Blue, 20 Month EMA Yellow, 50 Month EMA Red, 100 Month EMA Light Blue, 200 Month EMA Violet, DOUBLE BOLLINGER BANDS: Normal 2 Standard Deviations Green, 1 Standard Deviation Orange. Green downtrend line from EURUSD peak of July 2008 to present, green uptrend line from August 2012 to present. White Fibonacci retracement lines for downtrend of August 2008 To June 2010, yellow Fibonacci retracement lines for downtrend of May 2011 To July 2011.
Source: MetaQuotes Software Corp, www.fxempire.com, www.thesensibleguidetoforex.com
03 Jun. 14 21.58 or 02 Jun. 14 21.57 not in
Key Points To Note
Just for long term perspective, note how the descending long term EURUSD trend line from August 2008 now seems once again alive and well, after 3 months of failed tests from February through May. Midway through June, with EU bond rates falling and the EUR’s rate/yield advantage fading, odds favor June closing in the red, if not below the shorter term uptrend line from mid-2012.
Medium Term EURUSD Outlook Per Weekly Chart: Neutral, On The Brink Of Bearish
If we get a confirmed break below support at 1.35, time to call at least top for the 2012 uptrend. A break below the 1.34 zone would suggest a reversal and new downtrend.
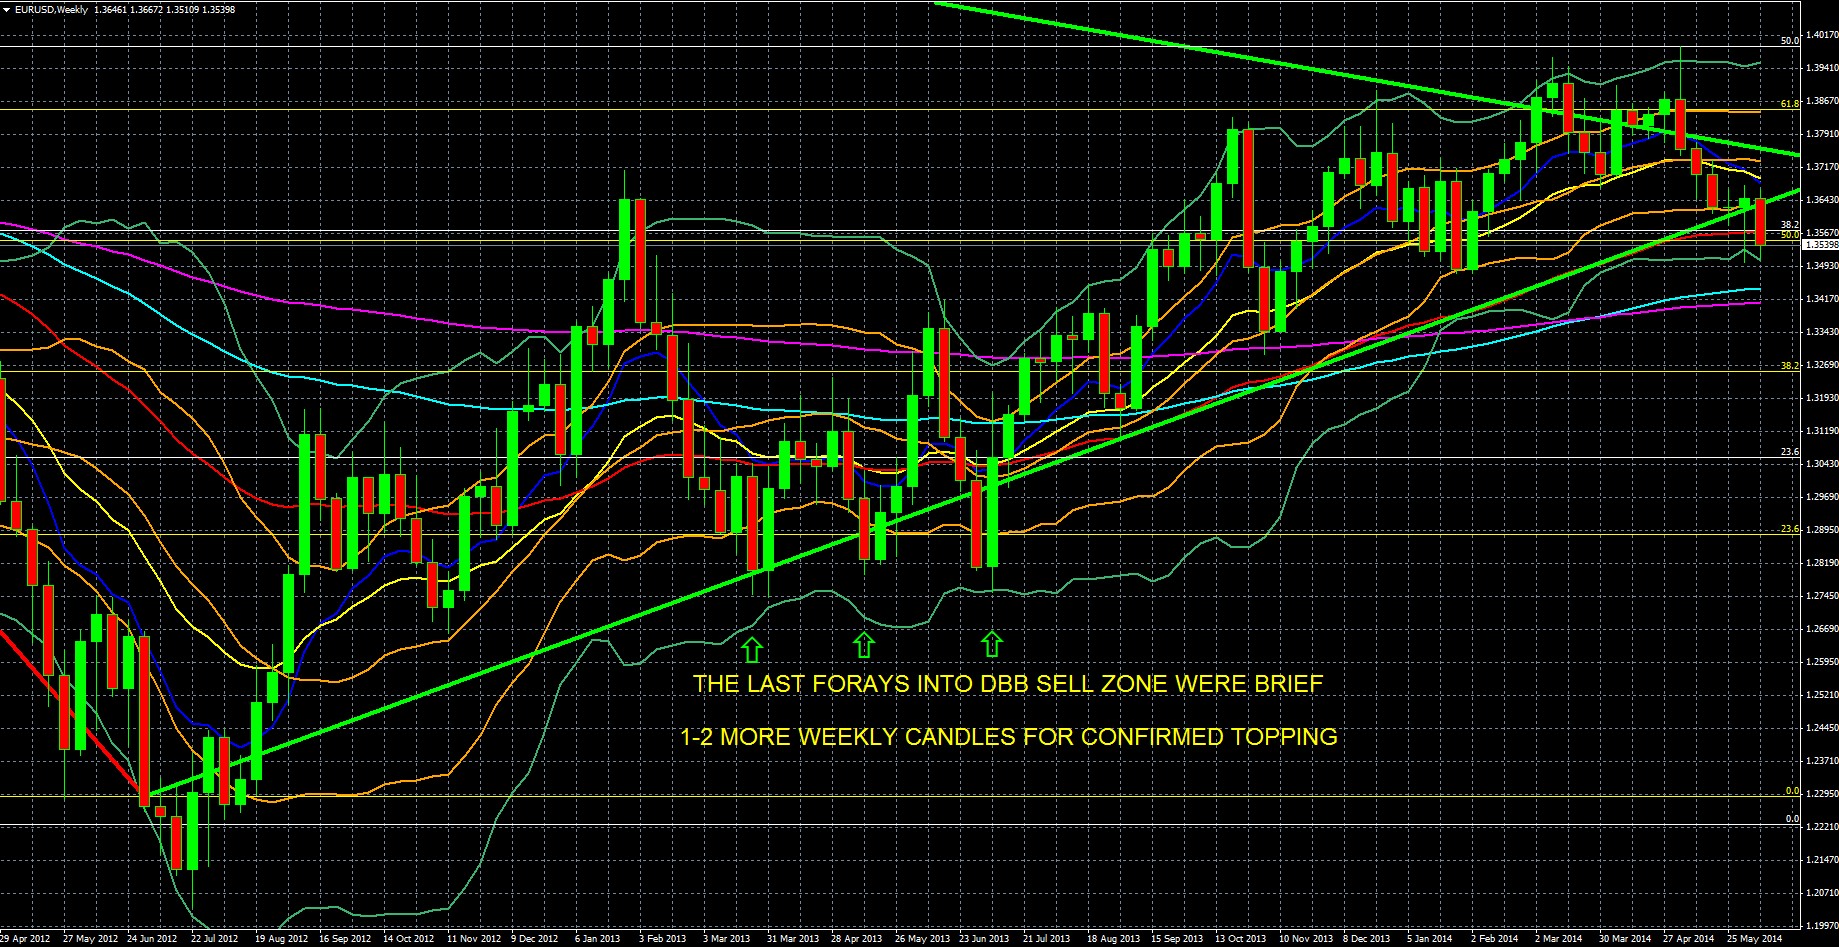
EURUSD Weekly Chart 29 April 2012 To Present
KEY: 10 Week EMA Dark Blue, 20 WEEK EMA Yellow, 50 WEEK EMA Red, 100 WEEK EMA Light Blue, 200 WEEK EMA Violet, DOUBLE BOLLINGER BANDS: Normal 2 Standard Deviations Green, 1 Standard Deviation Orange. Green downtrend line from EURUSD peak of July 2008 to present, green uptrend line from August 2012 to present. White Fibonacci retracement lines for downtrend of August 2008 To June 2010, yellow Fibonacci retracement lines for downtrend of May 2011 To July 2011.
Source: MetaQuotes Software Corp, www.fxempire.com, www.thesensibleguidetoforex.com
04 Jun. 14 22.27
Key Points To Note: Breakout Below 19 Week Trading Range?
Medium term technical outlook turns bearish for the coming weeks.
Bullish: The only bullish element on the weekly chart is that the 1.355 area that forms the bottom of the 18 week trading range is bending but the 1.3539 weekly close isn’t a decisive break of this price level, and is still within it. Until we get new bearish fundamentals on the scene, the 1.355 support area and 18 week trading range still deserve respect, albeit less than before.
Bearish: Everything else on the chart puts the odds in favor of more downside in the coming weeks.
After two straight indecisive weekly doji or near-doji candles, we’ve had
- Multiple key support levels broken by this week’s very decisive engulfing bearish “Marubozu” shape candle showing a close near the bottom of its weekly range, which was materially lower as it broke multiple strong support levels that had converged around the 1.355 area as discussed below.
- Momentum indicators moving from neutral to decisively bearish
- It not only closed below 1.36 for the first time in 19 weeks, but also closed below the EURUSD’s uptrend line (that began in mid-2012) for the first time since July of 2013, violating both a short and long term key support level, and with a weekly close well below these.
- It also closed below 3 more key support indicators: the 50 week EMA and the long term 38.2% Fibonacci level and medium term 50% Fib level. Granted, the close was not far below these, so we won’t call this week’s price action a confirmed breakdown of these support levels until we see 1-2 more weekly closes below them.
- The 10 and 20 week EMAs now turning down and the 10 week EMA crossing below the 20 week EMA, which would be yet another bearish sign of slowing momentum. Note that the 20 week EMA is the 200 day EMA. A confirmed break below this generally signals a prolonged drift lower. The definition of a ‘confirmed’ break below or above a given support or resistance level is personal one, we discuss ours below.
- The EURUSD has now closed firmly within/ at the bottom of the double Bollinger® band sell zone (DBBSZ). This is major technical damage, and our strongest evidence to date of further downside ahead, which would mean at least a test of the 1.35-1.34 area.
- A confirmed break below that zone (2-3 consecutive weekly closes depending on your risk tolerance) would mean the ~ two year uptrend is over. It would also mean 2-3 weeks in the DBBSZ, strengthening downward momentum.
- Note also however, that the last two times that weekly candles closed below that 2012 uptrend line, these breaks never lasted beyond 2 weeks. Therefore we hesitate to declare the uptrend line “decisively” broken and declare a “confirmed breakdown” of this support until we get another 2 weekly closes below it.
- That said, a close below the 1.355 area ups the odds for an end to the uptrend. It would put the pair below its 50 week (250 day) EMA as well as the 50% fib retracement of the 2011-2012 downtrend and would strengthen the case that the EURUSD is topping out.
- A confirmed break below 1.35-1.34 would be decisive signal that the EURUSD’s uptrend has ended for now. Below the 1.35 area we break below 19 week trading range support. However we would still have support of the big 100 and 200 week EMAs around the 1.34 area. Thus we’d have a top to the uptrend but not necessarily a reversal, as those EMAs might be support for another flat trading range.
Medium Term Support Buckling-Multiple Key Support Indicators Smashed
Momentum Has Turned Firmly Bearish On The Weekly Charts
Technical Signals To Watch: How Low Will It Go? Follow These Signals
However a confirmed move below the 1.34 zone means we’ve got some kind of a reversal going we’ve broken below resistance of that big round 1.34 number and those big EMAs. Downward momentum would also strengthen considerably, with additional shorter term EMAs crossing below longer term EMAs, sending further downward momentum signals.
In sum, a confirmed break below 1.35 signals and end to the uptrend with a chance of a new trading range with the 100 and 200 week EMAs providing the floor and some support against growing downward momentum. A confirmed move below 1.34 breaks that support and signals a likely medium term reversal.
See our fundamental outlook for what’s likely needed to save or kill the uptrend.
Near Term Technical Outlook For Coming Days Per Daily Chart: Downward Momentum Breaking Support

EURUSD Daily Chart 5 February 2014 To 13 June 20104
KEY: 10 Daily EMA Dark Blue, 20 Daily EMA Yellow, 50 Daily EMA Red, 100 Daily EMA Light Blue, 200 Daily EMA Violet,DOUBLE BOLLINGER BANDS: Normal 2 Standard Deviations Green, 1 Standard Deviation Orange. White Fibonacci retracement lines for downtrend of August 2008 To June 2010, yellow Fibonacci retracement lines for downtrend of May 2011 To July 2011.
Source: MetaQuotes Software Corp, www.fxempire.com, www.thesensibleguidetoforex.com
05 Jun. 14 22.54
Key Take-Aways Daily Chart: Bearish Near Term Momentum Breaking Through Support
Near term neutral-bearish for coming week per daily charts. The 1.355 area support which is being tested into the 1.353 area and is thus bending as strong bearish downward momentum on the daily charts is winning.
The pair has been firmly in the double Bollinger® band sell zone since early May (Draghi suggests new stimulus in coming in June). This indicator has correctly signaled more downside ahead, so a confirmed break below 1.355 and test of the 1.35 area seems likely in the days ahead.
Fundamental Outlook
The fundamentals behind the pair’s breakdown are more a story of EU weakness than US strength.
Long Term: Long Term Central Bank Policy Remains Bearish For The Pair
The long term downtrend line shown above has fundamental support from the key central banks, as the ECB eases while Fed (and BoE) policy is steady-to-slightly more hawkish. Long term investors should be considering entering new short positions.
Medium And Short Term: Weak US Yields, Mixed Data Cut Chances Of New EURUSD Downtrend
For all the talk of low EU rates and economic weakness, and new ECB easing, the USD’s fundamentals haven’t been good enough yet to bring the next leg of the long term EURUSD downtrend.
Despite a May US Nonfarm Payrolls report with headline jobs growth over 200K for the four straight month (the first such streak since October 1999 to January 2000), the USD has been among the worst performing currencies. For perspective, the USD’s outperformance against the Euro and the Swiss Franc came only after the ECB announced its June 5th stimulus.
The belly of the yield curve (3Y-7Y) has steepened a bit over the past week and month, however longer term interest rates (10Y-30Y) remain suppressed. This is significant because long-term interest rates are more sensitive to speculation on Fed rate changes than short-term interest rates. In sum, the market isn’t pricing in a Fed rate hike anytime soon.
The USD is also undermined by tepid US data. While there have been small signs of a Q2 economic snapback (automobile sales, housing starts, jobless claims, and retail sales), the top tier data continues to suggest a long slow recovery that supports the growing belief that the Fed will keep rates lower for longer, for reasons we discussed in depth here.
Weak data and rate expectations are preventing a USD bull market, so the USD needs something to change those expectations. Its best hope for that lies with the upcoming June FOMC policy meeting this week.
FOMC Meeting Could Be The Key EURUSD Event This Week
The best possible scenario for USD bulls would be that the 6.3% unemployment rate, convinces the FOMC that the labor market is reaching its natural rate faster than expected, and that the FOMC thus needs to consider raising interest rates sooner, than the time which markets have currently priced in, Q3 or Q4 of 2015.
However while the FOMC meeting may spark some volatility, we doubt it provides enough surprise to materially move the pair. Conversely, another dose of dovishness and pessimism could bolster support at 1.35 and preserve hopes for another bounce higher.
Other data is not supportive of an accelerated rate hike schedule. Wage growth remains minimal, thus undercutting the idea that slack is disappearing from the labor market. There is only minimal evidence that inflation will soon hit the Fed’s 2% threshold consistently. Core CPI hasn’t hit +2.0% for 2 straight months since June-July 2012. Friday’s economic reports didn’t help, with producer prices dropping 0.2% and the University of Michigan consumer confidence index slipping to a 3 month low.
Risk Appetite Remains Supportive of the EURUSD If Rate Differentials Remain Constant
With low rates and no economic scares brewing, overall risk appetite as reflected by the leading US and European indexes should be at least steady if not continuing to drift higher.
The big question is when the long anticipated USD rate advantage appears, if not from Fed tightening, then further ECB easing while US rates stay steady.
Once the USD has even a minor rate advantage, then the EUR becomes the carry-trade funding currency of the two, and the EURUSD becomes a safe haven pair, with rising risk appetite driving it lower as the risk appetite strengthens the USD versus the EUR.
Continued Demand for EU Peripheral Bonds Fails To Help EUR
Demand for these assets has been a mainstay of the EUR’s support. The bounce off 1.35 was not strong, and a weekly close below that level would be damaging.
Top Calendar Events For Both Overall Risk Appetite And Specific To The EURUSD
With both Fed and ECB policy expected to remain steady in coming months, (even the ECB will need to wait at least 3 months before it has enough data to evaluate future options) the pair is moving with EU and US rate speculation and overall risk appetite. This week’s calendar has little chance of influencing sentiment on either. Top events marked in boldface. Other than the FOMC meeting, German ZEW and PPI have potential if they either ease or raise fears of deflation threats.
Monday: No top tier events likely to materially influence the pair’s weekly price action.
Tuesday
EU: Germany ZEW economic sentiment report
US: Building permits, CPI, Housing starts
Wednesday
EU: German 10 year bond auction
US: FOMC rate statement, economic projections, press conference
Thursday
EU: Euro group meetings
US: New jobless first time claims, Philly Fed Mfg Index
Friday
EU: German PPI, current account, ECOFIN meetings
Sample Retail Traders Positioning
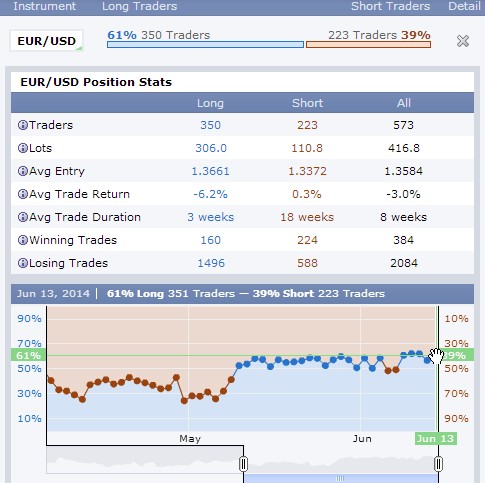
Source: forexfactory.com
06 Jun. 14 23.44
As with retail traders in general, this real time sample shows they remain returned to being overall long the pair, apparently hoping to play the bounce that has yet to happen.
Conclusions
Short & Medium Term Outlook & What Could Change It
The technical outlook for the coming days and months is bearish. The medium term remains neutral until we’ve a break below the 1.34 area and remaining nearby support on the weekly charts.
With both Fed policy unlikely to change for the foreseeable future, and no further easing from the ECB for at least 3 months as it monitors the effects of its recent stimulus moves, actual central bank policy is not moving the pair in the coming months. What might?
- Interest rates: A change in benchmark 10 year notes for either currency.
- EU data that influences speculation on ECB policy: EU data that is believed to be most influential in shaping the timing and scope of the next round of ECB stimulus (probably an ECB version of outright QE, for reasons we discussed in depth here last week) is going to assume new added importance, like monthly jobs data used to have for the US. Inflation reports will be key, along with other top tier growth metrics.
- Overall risk appetite: If central bank policy and rates are seen as staying steady, the pair is likely to move with overall risk appetite. As long as rates stay low and there are no crises that truly threaten the global economy (Ukraine and China tensions not seen as doing that) then we’ve got the same ingredients present for a continued bull market in the leading stock indexes. That should limit EURUSD downside to 1.34 as a worst case for the foreseeable future, unless somehow markets awaken to the threats of another EU crisis.
Long Term: Bearish
The long term downtrend line looks safer as we appear to be developing a second lower monthly close and retreat from that downtrend line’s resistance, as shown in the above monthly chart. It now has fundamental support from the key central banks, as the ECB eases while Fed (and BoE) policy is steady-to-slightly more hawkish. Long term investors should be considering entering new short positions, as the pair is now in the double Bollinger® band sell zone on the weekly charts for the first time in nearly a year. Another 1-2 weeks in that lower sell zone, especially if accompanied by a confirmed breakdown below 1.35, would be adequate confirmation that the long term downtrend is alive and well.
That would signal a good entry point for long term shorts.
To be added to Cliff’s email distribution list, just click here, and leave your name, email address, and request to be on the mailing list for alerts of future posts. For information on a free intro to currencies video course based on my award winning book, see here.
DISCLOSURE /DISCLAIMER: THE ABOVE IS FOR INFORMATIONAL PURPOSES ONLY, RESPONSIBILITY FOR ALL TRADING OR INVESTING DECISIONS LIES SOLELY WITH THE READER.

