EURUSD Weekly Outlook: Downtrend To Resume Or Reverse? Here’s What Decides
FX Traders’ weekly EURUSD fundamental & technical picture, this week’s market drivers that could change it- the bullish, the bearish and likely EURUSD direction.
The following is a partial summary of the conclusions from the fxempire.com weekly analysts’ meeting in which we cover outlooks for the major pairs for the coming week and beyond.
Summary
- Technical Outlook: Near term neutral, longer term bearish as detailed below.
- Fundamental Outlook: Neutral Near Term, Bearish Longer Term & Why
- Trader Positioning: Longs Primed To Capitulate On Signs Of Further Weakness?
TECHNICAL OUTLOOK
First we look at overall risk appetite as portrayed by our sample of global indexes, because the EURUSD has been tracking these fairly well recently.
Overall Risk Appetite Per Weekly Charts Of Leading Global Stock Indexes: Bearish For EURUSD
Our sample of weekly charts for leading global stock indexes paints a bearish picture for the coming week and beyond for overall risk appetite, and this provides a bearish background context for the EURUSD.
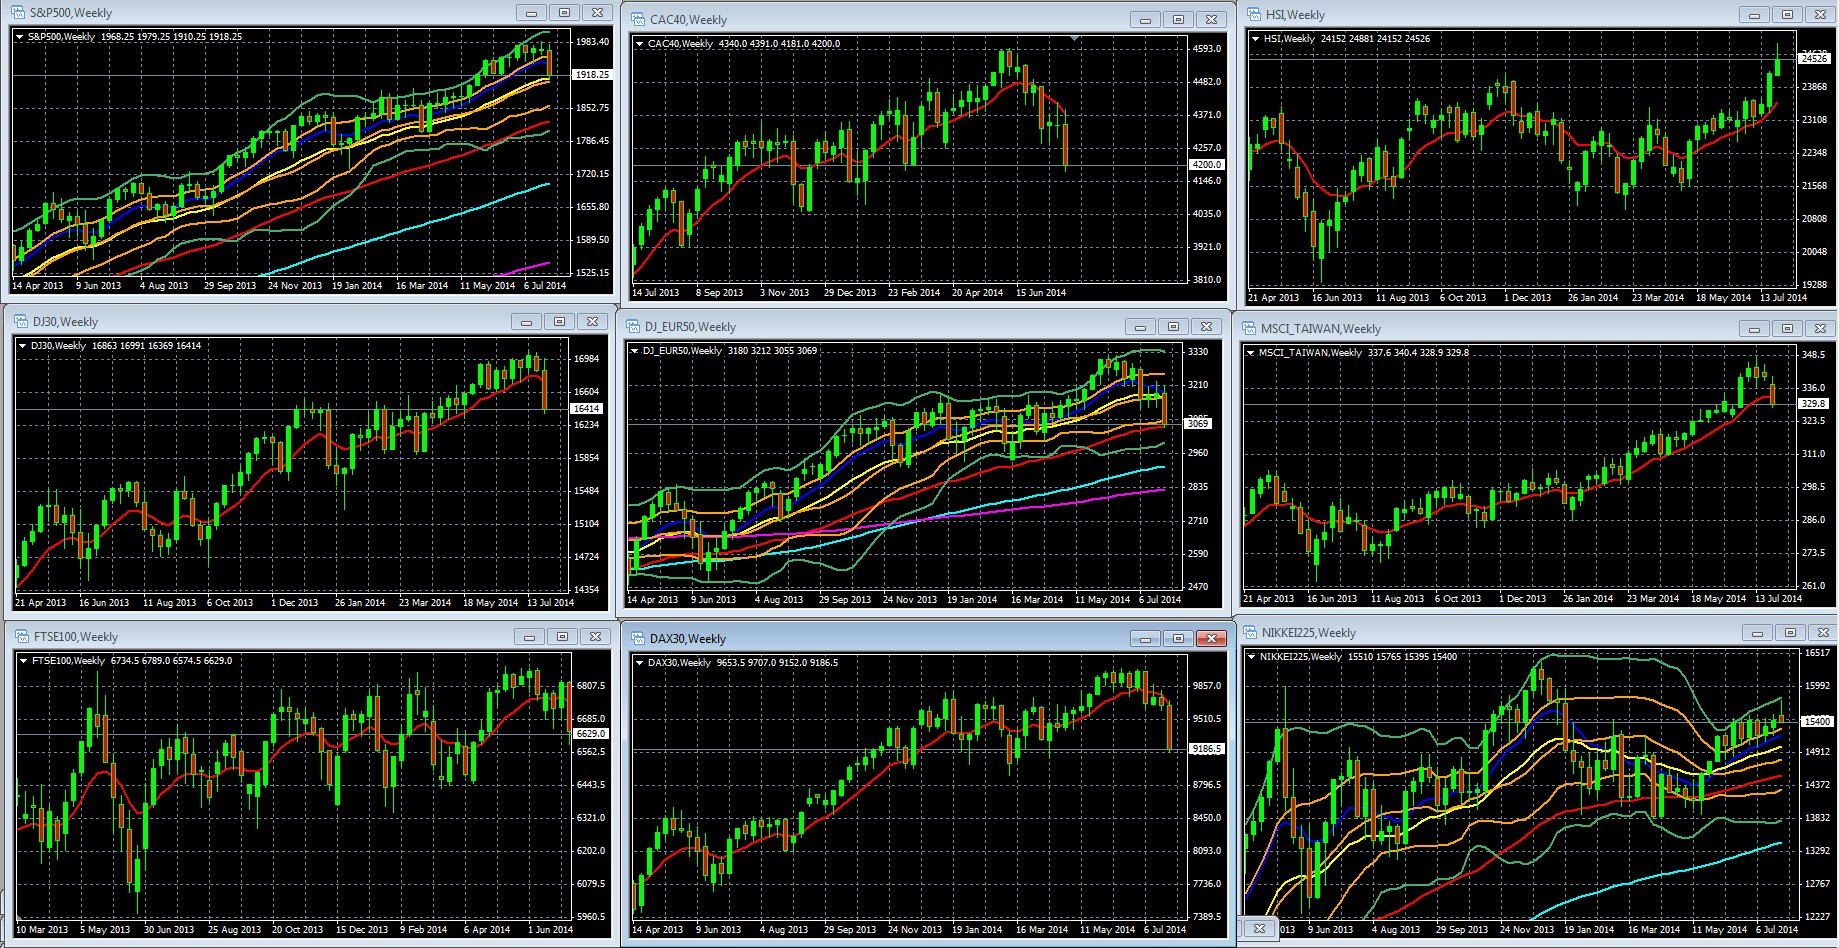
Weekly Charts Of Large Cap Global Indexes April 14 2013 to Present, With 10 Week/200 Day EMA In Red: LEFT COLUMN TOP TO BOTTOM: S&P 500, DJ 30, FTSE 100, MIDDLE: CAC 40, DJ EUR 50, DAX 30, RIGHT: HANG SENG, MSCI TAIWAN, NIKKEI 225
Key For S&P 500, DJ EUR 50, Nikkei 225 Weekly Chart: 10 Week EMA Dark Blue, 20 WEEK EMA Yellow, 50 WEEK EMA Red, 100 WEEK EMA Light Blue, 200 WEEK EMA Violet, DOUBLE BOLLINGER BANDS: Normal 2 Standard Deviations Green, 1 Standard Deviation Orange.
Source: MetaQuotes Software Corp, www.fxempire.com, www.thesensibleguidetoforex.com
01 Aug. 02 21.49
Key Take-Aways: EURUSD Now Correlating Better With European Indexes Than With The S&P 500
As the world’s most liquid pair, it generally tracks the most liquid stock index, the S&P 500 better than any of the other leading global indexes. However since June 2014 it has correlated most closely with the leading European indexes, particularly those of the biggest EU economies, Germany and France, which have been moving lower since early June. The EURUSD has been in its most recent downtrend since early May, and began the most recent phase of that pullback in late June.
That said, this correlation applies over the past months but did not work at all well this past week, so the correlation is hardly a lock-step day-by day thing. The EURUSD’s main moves lower came on Tuesday and Wednesday, whereas EU stocks were flat Tuesday, and made their main drop on Thursday while the EURUSD moved little that day.
We also note that the leading US and EU indexes’ are falling at a slower pace, and remain in their double Bollinger® band neutral zone, whereas the EURUSD is plunging faster, as detailed below.
This change in correlations bears watching going forward.
EURUSD Weekly Technical Outlook: Downtrend Resuming Or Reversing?

EURUSD Weekly Chart June 24 2012 to Present
KEY: 10 Week EMA Dark Blue, 20 WEEK EMA Yellow, 50 WEEK EMA Red, 100 WEEK EMA Light Blue, 200 WEEK EMA Violet, DOUBLE BOLLINGER BANDS: Normal 2 Standard Deviations Green, 1 Standard Deviation Orange. Green downtrend line from EURUSD peak of July 2008 to present, green uptrend line from August 2012 to present. White Fibonacci retracement lines for downtrend of August 2008 To June 2010, yellow Fibonacci retracement lines for downtrend of May 2011 To July 2011.
Source: MetaQuotes Software Corp, www.fxempire.com, www.thesensibleguidetoforex.com
02 Aug. 02 21.58
Key Take-Aways Weekly Chart: Bearish Medium Term Outlook
The medium term outlook continues to deteriorate from a variety of technical perspectives, chart patterns, support breakdowns, and strengthening downwards momentum. In addition, the pair is poised to resume its descending channel from May after a 5 week breakout above it. Here are the details.
- -Bearish Head And Shoulder Pattern: It’s hardly a classic H&S pattern given the head is dispersed over a few weeks and the somewhat asymmetrical and lopsided shoulders in December 2013 and June 2014 (the June shoulder’s a bit lower). However the principal behind the H&S pattern applies here. That is, a failed attempt to rally, followed by further declines that suggest the EURUSD’s rally that began in mid-2012 is officially over.
Note the specific elements of the Head And Shoulders Topping Pattern:
- –We’ve a temporarily successful bounce off late January lows and drive a to new highs from December 2013 to March 2014
- –A pullback that bottoms in mid-June
- –A failed rally that tops out in early July, which, significantly, topped at resistance created by the medium term uptrend line dating back to June 2012, which proved its strength by resisting 4 straight weeks of tests. The current move lower has created a new series of lower lows and lower highs, aka a downtrend. The technical evidence of the new downtrend also includes violation of key support as detailed below.
- -Violation Of Key Support: Over the past 3 weeks the pair has broken through no less than 4 strong support levels, within which were 6 key technical support indicators:
- –1.3575 area, which also includes the term 38.2% Fib retracement of the long term downtrend beginning August 2008 – June 2010 (white).
- –13560 zone, which also includes the 50% Fib retracement of the medium term downtrend from May – July 2011 (yellow), and the 50 week (200 day) EMA (red)
- –The 1.3455 area, which includes the 100 Week EMA
- –The 1.3450 band, which includes the 200 Week EMA, as well as the upper descending channel line. This was violated early in the week and ultimately held (barely) only because of the weak US jobs figures Friday.
- -Accelerating Downward Momentum
- —All EMAs trending lower except for the longest term, least sensitive 100 and 200 week EMAs, which have flattened. The 10 and 20 week EMAs (red and yellow) are close to crossing below the 50 week EMA (red), which would signal more entrenched momentum, as does…
- —The pair completes its third straight week in the DBB sell zone, and is not hugging the bottom of this zone for the second straight week
- Poised For Resumption Of The Descending Channel (Violet): The channel dates back to May. After a 4 week breakout higher, the EURUSD returned to the upper edge of this channel last week. Not surprisingly, that decline paused at support of the 200 week EMA around 1.34, after a test of the next major support level at 1.355 failed due to Fridays weaker than expected US NFP and unemployment reports. These dampened speculation about an earlier than expected tightening, thus it’s not surprising that the pair closed at round 1.343, given the dual support of the upper channel line and 200 week EMA.
Conclusion: Likely Trading Range 1.355 Upside, To 1.335 Downside, Odds Favor Further Downside
Upside in the coming week is likely to be capped around the 1.343-55 area given the 3 former support levels that have now become resistance: the upper descending channel line, and both the 100 and 200 week EMAs.
The recent violations of support and accelerating downward momentum open the way for a test of the next meaningful support level around 1.335 zone, which provided support and resistance at 4 different times on the weekly EURUSD chart in 2013.
Now let’s look at the fundamentals behind the move and what lessons we can derive from them for the weeks ahead.
FUNDAMENTAL OUTLOOK: Market Movers And Lessons
Top Market Movers: Continued Trends in Data, Risk Aversion Countered By Soft US Jobs Reports
Driven Lower By Data, Risk Aversion Tuesday And Wednesday
The big down moves for the pair this week came on Tuesday and Wednesday.
On Tuesday, German and Spanish 10 year bond yields dropped to a record low on what appears to be a drive for safety following an agreement among European governments to impose new sanctions on Russia in the wake of the outcry over the downed Malaysian jetliner but Russian-backed forces. Lower yields threaten to reduce demand for these bonds and the Euros needed to buy them. The sanctions also specifically hurt confidence in the EU’s economy given the potential loss of Russian business, and also feed demand for safer haven assets and currencies in general, and so new EU sanctions favor the USD over the EUR. Although in the past new rounds of sanctions against Russia have not materially affected trade, even those mostly symbolic acts have had at least temporary influence on EU economic confidence.
On Wednesday, the pair’s drop was fueled by a combination of
- -A better than expected US GDP rebound that failed to boost general risk appetite on doubts about whether the figure merely reflected a temporary risen in inventories that could foreshadow future production declines.
- -The FOMC’s latest policy decision release came out as expected, with the FOMC taking another $10 billion off its monthly asset purchases and keeping interest rates between 0% – 0.25%. The written statement revealed nothing new, indicating that the US recovery is progressing but that slack capacity in the labor market remains. That said, Citibank’s Steven Englander noted that, for the first time, the Fed is clearly indicating that data is approaching both the Fed’s labor and inflation targets.
- -Some weaker than expected European earnings reports that had European indexes down solidly on the day while US indexes closed mixed, with a flat to slightly higher overall net result for the big 3 US indexes
The combined effect of the above was to again put both sentiment and rate expectations in favor of the USD.
Indeed, some analysts believed the US GDP beat was better than market reactions suggested.
Per Chris Rupkey, chief economist at Bank of Tokyo Mitsubishi UFJ, consumer spending is upbeat, particularly for the auto industry. “Car sales added 0.4 to the 4.0% GDP and should have with car sales shooting higher to a 16.9 million normal annual rate of sales in June. If the Fed had car sales on the dashboard they would raise rates right now.”
In sum, the day’s big news didn’t generate enough risk appetite to help the EUR override the continued indications of coming USD strength.
Friday Bounce On Weak US Jobs Report Cooling USD Rate Hike Hopes
The minor NFP miss was enough to fuel some short covering at a key support level and give the EURUSD a boost to recover all of its losses on the week, as rate hike speculation cooled and gave an already dovish Fed a bit of confirmation of its views (expressed Thursday) that the US job market wasn’t strong enough to justify a change in the Fed’s dovish outlook.
That said, the report came in only a bit below expectations, and was still above the 200k new jobs per month needed to keep up with the monthly growth in job seekers. The US job picture hasn’t changed, the slow and steady improvement theme remains. The result was well within expectations of a somewhat softer figure than seen in the prior month, but expectations got a bit ahead of the reality.
Lessons For The Coming Week
Hopes For Accelerated Fed Tightening Dampened
Twice this week we had major data releases from the US side, neither of which were bad or even unexpected. However they did weaken hopes for an accelerated Fed tightening that were behind much of the latest EURUSD moves lower.
The July FOMC Announcement And US Jobs Reports Not Enough To Sustain Downtrend For Now
The USD retreated after the FOMC statement, which wasn’t hawkish enough to continue Thursday’s upward move, though the USD still finished marginally higher against the EUR.
The Fed doesn’t see enough of an increase in jobs or inflation figures to alter its guidance. The annual Jackson Hole economic summit has in the past served as a venue for indicating policy changes, so perhaps another month of data may be enough to make August Jackson Hole Summit the next big chance.
The taper continues but rates are to remain low for an extended period long after QE ends.
As noted above, Friday’s jobs reports weren’t far off expectations, but they weren’t good enough to sustain hopes for faster Fed tightening.
What’s Need To Sustain Or Reverse the Current EURUSD Downtrend
As before, the pair will move with changes in either:
- Expectations about the timing of the expected USD interest rate trend higher
- Risk sentiment: Thus far central banks remain very accommodative and geopolitical events are only beginning to threaten risk appetite. Yes, stocks have been moving lower, but the thus far the decline’s pace and scope suggest nothing more than a normal correction within an overall bull market.
Top Market Moving Events To Watch This Week
Here’s a quick rundown of the events with the most potential to move the EURUSD if they provide any kind of surprise. For perspective, we’re not expecting a lot of market movement from any of them unless they really surprise markets, especially now that we’re firmly into the summer vacation market doldrums.
ECB Rate Statement: This is the only big, specific EURUSD report of the week because it’s the only thing on the calendar that might influence speculation about relative benchmark rates for the two currencies. The ECB is expected to keep rates and policy unchanged, however Mario Draghi’s press conference comments often move the EUR. The current low level of inflation supports continued ECB dovishness, so any surprises are likely to come in the form of something that raises expectations for stimulus coming faster or in larger doses than expected.
The US ISM non-manufacturing PMI (Tuesday) would normally be a big potential market mover because it’s a leading indicator of the monthly US jobs reports that normally come 1-2 days later. However now that these reports are out, the ISM report is less likely to matter unless it really surprises.
China: Non-manufacturing PMI (Sunday), HSBC services PMI (Tuesday) (Friday) and Trade Balance and inflation data (Saturday). Economists expect to see modestly weaker figures that still confirm the picture of a stabilizing slowdown that has the worst behind it. These matter to the extent that they influence the overall risk appetite with which the EURUSD moves.
We’ve omitted mention of other central bank monthly rate statements that we don’t believe will surprise or move markets.
Other Calendar Events To Watch – An Expanded Version
Sunday
China: Non-Manufacturing PMI, important because top tier data, like that of the US and Europe, moves overall global risk sentiment, which in turn is positively correlated to the EURUSD. The better the data, the more bullish for the EURUSD.
Monday: Nothing
Tuesday
China: HSBC Services PMI
EU
Spain, Italy, EU services PMI, EU retail sales
US: ISM non-mfg PMI, factory orders
Wednesday
US trade balance
Thursday
EU: ECB rate statement and press conference
Friday
China trade balance
Japan: BoJ rate statement and press conference
EU: French industrial production
Saturday: China CPI, PPI y/y
Sample Retail Traders Positioning
The below real time sample of retail traders shows little change over the prior week. Note the strong shift to long positions in July as the EURUSD had moved in the opposite direction. If the below picture is indicative of a broader market positioning, then we’ve got a lot of traders in the red who could be ready to shift to the short side if support at 1.343 breaks down and the pair resumes its downtrend.

Source: forexfactory.com
04 Aug. 02 23.35
For other lessons and background context, stay tuned for our coming weekly preview here.
To be added to Cliff’s email distribution list, just click here, and leave your name, email address, and request to be on the mailing list for alerts of future posts. For information on a free intro to currencies video course based on my award winning book, see here.
DISCLOSURE /DISCLAIMER: THE ABOVE IS FOR INFORMATIONAL PURPOSES ONLY, RESPONSIBILITY FOR ALL TRADING OR INVESTING DECISIONS LIES SOLELY WITH THE READER.

