EURUSD Weekly Outlook February 24th: Trend Vs. Resistance-Which Wins & Why
EURUSD bullish and bearish technical, fundamental drivers for both short and longer term plus more on the big long term bearish threat to the pair – The Europeans themselves, a real-time trader positioning sample & links to details on key market drivers for spot forex and FXE, UUP and related ETF and related EURUSD derivatives traders & investors
The following is a partial summary of the conclusions from the fxempire.com weekly analysts’ meeting regarding the outlook for the EURUSD, market drivers, likely trading price action, etc.
Highlights
- Weekly Technical Picture & Commentary
- Fundamental EURUSD Drivers This Week
- Bullish
- Bearish
- Real Time Trader Positioning Sample
- Top Calendar Events
- Conclusions For The Coming Week EURUSD Outlook And Beyond
Weekly Technical Picture & Commentary
As we noted last week here
…the pair has decisively regained its uptrend line, broke out above its descending channel, and is poised to re-enter its upper double Bollinger band zone that suggests reliable upward momentum and thus more upside ahead. The moving averages continue trending higher, so the overall picture is still one of continued upward momentum in the medium term.
We also wrote that for those working off of daily charts, the next resistance points were 1.3720, then 1.3770.
Here’s the updated weekly chart.

EURUSD Weekly Chart April 2013 to Present
KEY:10 Week EMA Dark Blue, 20 WEEK EMA Yellow, 50 WEEK EMA Red, 100 WEEK EMA Light Blue, 200 WEEK EMA Violet, DOUBLE BOLLINGER BANDS: Normal 2 Standard Deviations Green, 1 Standard Deviation Orange
04 Feb. 22 23.27
Bullish Points: Short Term Remains Bullish
As we see from the updated weekly EURUSD chart above that nascent uptrend has been reinforced this week.
The bullish points to note include:
- The pair closed higher, confirming the breakout above the dual resistance of 1.3700 price level and 61.8% fib retracement of the prior downtrend
- It broke through first of those two near term resistance points of 1.3720, which now becomes near term support.
- The pair managed to return to its double Bollinger band buy zone (bounded by the upper green and orange Bollinger bands), albeit just barely, suggesting stronger, more reliable momentum and at least another test of the 1.3770 resistance area, if not multi-year resistance at 1.3800.
Bearish Points: Stronger Resistance Nearby, Risk Appetite Gauges Look Tired, Lack New Fundamental Fuel
The only bearish technical points are that the EURUSD rally appears close to exhaustion without some kind of significant new fundamental support that is not currently on the horizon. The next resistance levels are tougher to break.
- The higher resistance area around 1.3770 was tested but held. It is reinforced by the fact that it is the 61.8% fib retracement of the big EURUSD downtrend that began in April of 2011, when the EU crisis really started to hit.
A break above that 1.3800 level will be harder. By virtue of its age and durability (it has held since mid-2011 and survived two tests in October and December of 2013) this is an even tougher resistance level.
The pair tends to move with overall risk appetite as portrayed by major indexes like the S&P 500. However that gauge of overall risk appetite is currently stalled. Look at what’s happening with risk appetite in general, as portrayed by out sample of weekly charts of leading global stock indexes.
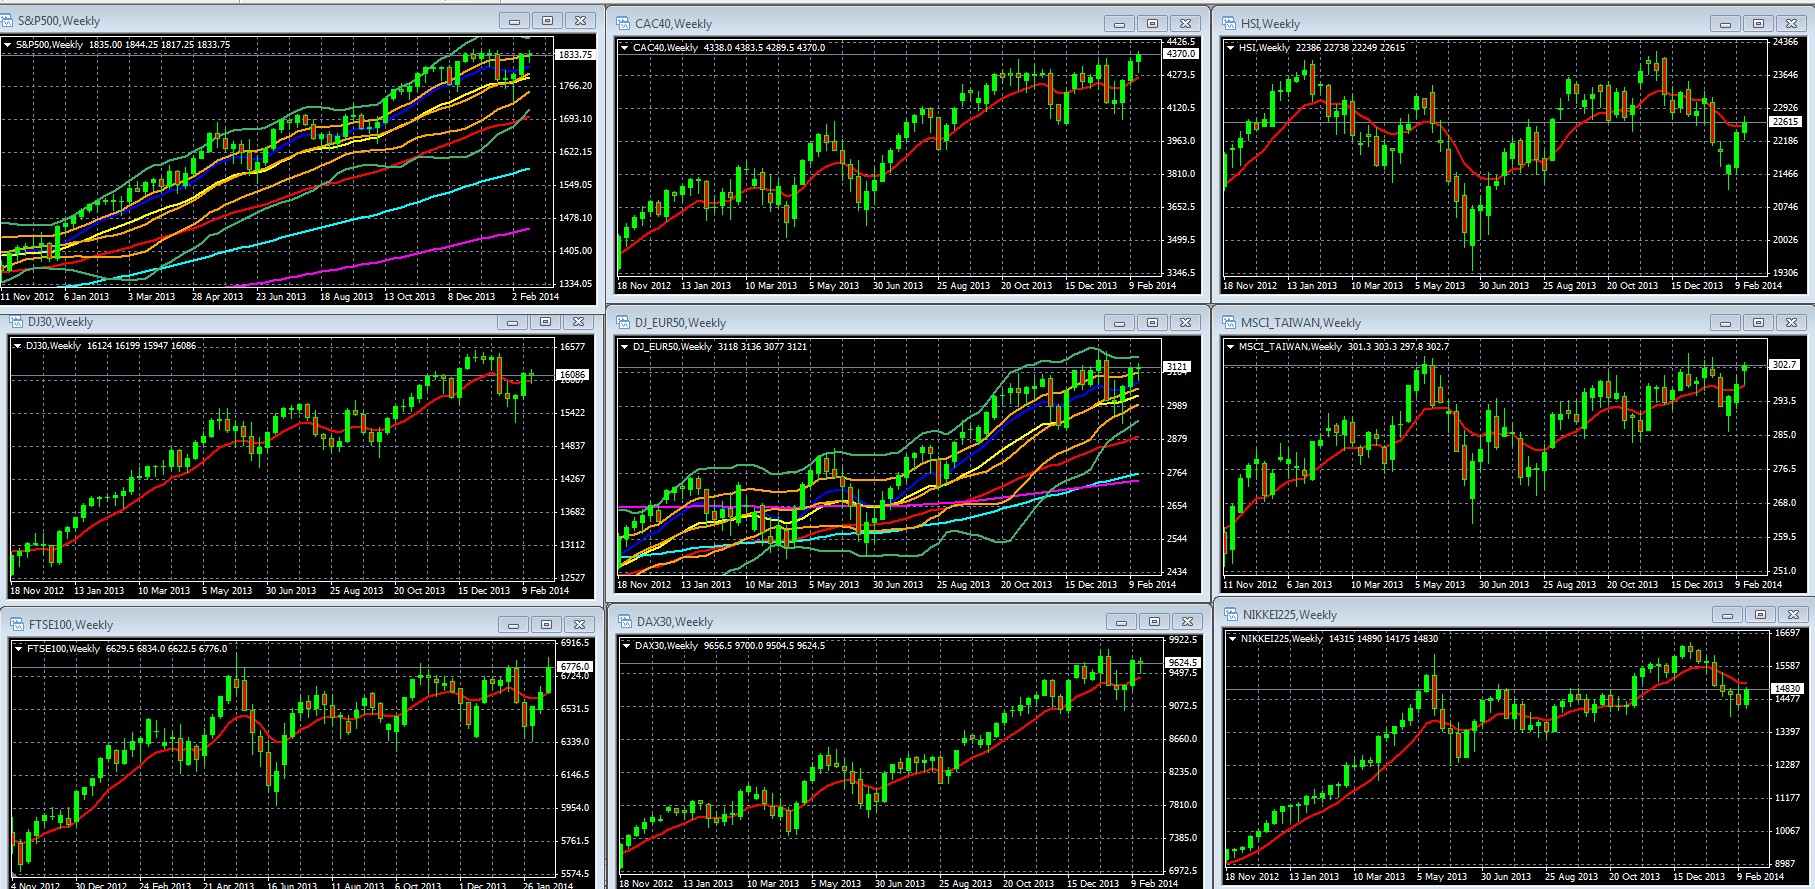
Weekly Charts Of Large Cap Global Indexes With 10 Week/200 Day EMA IN RED: LEFT COLUMN TOP TO BOTTOM: S&P 500, DJ 30, FTSE 100, MIDDLE: CAC 40, DJ EUR 50, DAX 30, RIGHT: HANG SENG, MSCI TAIWAN, NIKKEI 225
FOR S&P 500 AND DJ EUR 50 WEEKLY CHART OCTOBER 2012 – PRESENT:10 WEEK EMA Dark Blue, 20 WEEK EMA Yellow, 50 WEEK EMA Red, 100 WEEK EMA Light Blue, 200 WEEK EMA Violet, Double Bollinger Bands: Normal 2 Standard Deviations Green, 1 Standard Deviation Orange
Source: MetaQuotes Software Corp, www.fxempire.com, www.thesensibleguidetoforex.com
02 Feb. 22 20.43
Note how US and European indexes mostly went nowhere, as indicated by frequent “doji star” weekly candles (shaped like “+) signs. This candle shape generally indicates indecision, and is especially significant when a trend hits major support or resistance, because it shows markets are respecting that resistance and are unlikely to break past it until they get a reason to do so.
Note also in the two charts in which we show double Bollinger bands, the S&P 500 and DJ STOXX50, both bellwethers of US and Europe respectively, not only do both display these dojis as they approach strong resistance of multi-year or all-time highs, they also rest at the edge of their double Bollinger band buy zones.
In sum, we’ve a double-indication that risk appetite is hitting its limits given the current outlook for the fundamentals that have fueled the rally: global growth, earnings, and central bank policy. This price level (the 1850 area on the S&P 500) has been repeatedly tested since December hand has held firm, so until we get some material new fundamental drivers (better growth data, new easing?) the odds favor a period of flat range trading.
Growth remains at best slow and steady, and the next likely moves in interest rates from most major central banks are likely to be steady or higher. The two central banks most likely to consider further easing at this stage are the ECB and BoJ. If either did ease, that would benefit the USD versus the EUR.
FUNDAMENTAL PICTURE
Bullish
Nowotny Suggests No Major ECB Easing Coming
Last week Ewald Nowotny, head of the Austrian Central Bank and a key ECB member hinted that low inflation and a strong euro would start to “self-correct” this year without requiring major action from the ECB.
His comments suggested that the ECB may only consider minor action in the coming months. He ruled out a Fed-like QE, saying that such asset purchases would be difficult to implement within the ECB’s strict mandate. He also sounded skeptical about negative deposit rates for banks. Given that one of the core central banks is against it, we also doubt the ECB will take that route.
Data, Cash Inflows To European Stocks
The EU’s trade balance and current account are both in positive territory, which beats the deficits for the UK and the US, and current account surplus tends be currency supportive as these imply higher demand for the EUR.
Continued inflows into European stock funds also supports demand for the EUR, as outflows from Emerging markets (too risky) and the US (too expensive, assuming one believes there’s no serious EU crisis risk).
Trader Positioning
We noted last week that trader positioning had gotten even more loaded on the short side 34% long/66% short) as the pair climbed higher and more traders were tempted to attempt to predict the reversal before it actually begins. As we warn repeatedly in our book, attempting to time reversals before you have adequate confirmation is usually a losing strategy.
We warned that a break over 1.3700 could catch some fuel as weak hands folded and produced a bit of a short squeeze, which is what appears to have happened to some degree.
This week the EURUSUD short position has gotten more crowded even as the technical trend strengthened, as more traders anticipate resistance holding and creating some kind of reversal.

EURUSD Real Time Sample Retail Speculative Positioning, Average Holding Period 6 Weeks
Source: forexfactory.com
05 Feb. 23 01.27
Bearish
Easing Threats
Regarding the Nowotny comments referenced above, he advocated ensuring the banking system remained adequately funded, which could mean the ECB refrain from draining approximately EUR 170 billion from the markets to sterilize (i.e. neutralize the expansion in the EUR money supply) from ECB purchases of peripheral sovereign bonds under its SMP program.
That’s still easing and thus EUR bearish. However, to fair, as radical as that may seem for the ECB, it is a small amount relative to compared to what the Fed, BOJ, and PBOC have been doing. It’s also still not likely, given Germany’s current opposition and Draghi’s stated unwillingness to do unsterilized bond purchases without Germany’s ok.
Recent EUR Gains Not On Its Own Merits
Although the Euro was a top performing currency last week, that was as much as anything a product of weakness in its prime counterparts. The Australian and New Zealand Dollars were hit by weak Chinese data; the GBP and USD were both hit by weak data. The GBP suffered from underwhelming inflation and retail sales figures. The USD suffered from a string of weak data, most recently housing reports, while the Federal continues to slice away at its QE support.
Key Calendar Events
Overall there isn’t a lot of top tier EU data, and that leaves the pair to move more on two big US data points and overall risk appetite-driving events: The big events for the week are German inflation data, and US durable goods and preliminary CPI, as detailed below.
Monday
Germany: IFO business sentiment
EU: CPI – any surprisingly strong deflation signs increase the odds for some kind of ECB easing attempt, though as noted below about Friday, the odds of actual ECB action are much better if Germany is also feeling that pain.
Wednesday
US new home sales: a positive surprise could counteract the uniformly negative picture from last week’s housing data, though we’re more likely to see more of the same disappointment.
Thursday
US: Durable goods, weekly unemployment – durable goods is the more important of the two but either could help reverse the string of disappointing US economic data.
Friday
EU Flash CPI: Although EU CPI figures will also be reported, the one that matters is German CPI for February. Note well that the ECB has only actually acted against deflation threats when German inflation figures implied deflation: both the November 2013 rate cut and the July 2012 promise by ECB President Mario Draghi to do “whatever it takes” to save the Euro only came after Germany saw monthly deflation readings. This isn’t so surprising given that Germany is the chief obstacle to easing measures.
US: Preliminary GDP (expected to fall from 3.2% to 2.6%), pending home sales.
Saturday: China mfg PMI – is significant because it could move risk appetite up (bullish for the pair) or down.
Conclusions
The Coming Week
The EURUSD is already around 1.3730, a mere 70 pips from a very established, battle tested 1.3800 zone. This zone may well be tested, but can the pair really justify a sustained breakout without something to really get markets feeling generally optimistic or at least more bullish on the EUR?
A seventy pip range for long positions is small, and is strictly for short term traders. Similarly, we would not be convinced of much sustained downside potential, especially given the crowded short positioning, until we got break below 1.3620 (prior week’s open and 38.2% fib retracement line of the most recent pullback), and after that the uptrend line shown above around 1.3520. There
In short, the EURUSD is currently strictly a short term trader’s instrument.
Those with longer term (over a few days) holding period need to see a confirmed break above or below the past month’s range.
Such a break is unlikely without a material shift in risk appetite of the specific outlook for the EUR or USD. Neither the ECB nor Fed looks ready to make the kind of policy changes needed for that.
Longer Term: No EU Crisis Fixes Means Another EU Crisis
As we discussed in some depth in the concluding section of last week’s EURUSD outlook, the EU’s failure to make meaningful progress towards integration, or to fix any of the causes of the prior crises, leaves us as long term EURUSD bears. The heart of the problem was and remains that the popular support for a United States of Europe doesn’t exist, and will ultimately stymie the real reforms needed.
It’s just a matter of time before EU’s failure to create a meaningful bank safety net pressures the EUR. We suspected the first trouble would come when the ECB had to choose between weakening its coming bank stress tests and risking a crisis when it revealed undercapitalized banks with no safety net – that’s supposed to hit sometime in the latter part of this year.
However we could see the EUR pressured much sooner if Austria decides to heed its finance minister’s plan to force losses on private bank creditors of the struggling state bank Hypo Alpe Adria.
When that was first done in 2012 for Greek debt, it kicked off trouble shortly after for Spain and Italy as lenders are not stupid and saw a nasty precedent developing that made them reluctant to lend to banks of similarly shaky nations. Austria’s central bank head Ewald Nowotny warns that Austria risks losing credibility, saying:
“I believe our model of how a state should behave should be, if you like, more like Germany, should be more like Holland, and not so much Greece or Cyprus…”. See here for details.
There’s more at stake than Austria’s credibility and its banks future borrowing costs. Hypo’s home province of Carinthia provided guarantees for Hypo’s borrowing, and so risks being sucked “Ireland style” into insolvency if Hypo goes.
That’s not an encouraging image for a nation that’s supposed to be part of the stable core EU members’ group.
The EU has thus far chosen to avoid becoming “Bailout Nation” (to quote the title of Barry Ritholtz’s book) by instead becoming “doom loop nation.” Neither alternative is attractive, but to survive you need to avoid alternatives that include words like “doom.”
For more on the coming market week and the biggest threat, see here.
To be added to Cliff’s email distribution list, just click here, and leave your name, email address, and request to be on the mailing list for alerts of future posts.
DISCLOSURE /DISCLAIMER: THE ABOVE IS FOR INFORMATIONAL PURPOSES ONLY, RESPONSIBILITY FOR ALL TRADING OR INVESTING DECISIONS LIES SOLELY WITH THE READER.

